SLIC
IT Service Management –
Workflows, Reporting, Visibility.
360° View at your Services.
Highest Service Visibility
- are there any problems ? – if network, server, business – or website visitor
- all levels of technology – if cloud or datacenter, if industrial devices or or Wifi
- how critical elements effect each other – the firewall the bad user experience ?

What is unique about SLIC
- different data sources (network devices, firewall, capture Data, Google Data, Business data, actually any data … )
- different data types ( API import, Netflow, pcap data, SNMP: sysAgents, CSV/Json. Log Files)
- Data correlation
- – router overload effecting application performance
- – user satisfaction affected by firewall delay
- – Cloud Services problems affecting webshop revenue

SLIC does integrate in this view data from
- Server performance
- firewall logs
- routing protocols data
- pcap data for latency and packet loss
- DNS / NTP / VoIP Data – timing and status
- Website Cloudservice – timing and status
- Sysagents – ressources and load
Collection of technology service and business-related data
possible data sources:
- Raw IT data (network, system, event management, etc.)
- Business metrics
- User experience data
- User support tickets
- PCAP Data – any protocol fields / metrics
etc.
Input

Processing

- Evaluation of data against service profiles
- Create incidents when critical values are detected
- Comparison of incidents against configured service times
- Organization of data into service, business and technology structures.
- This allows for different perspectives on a service that also evaluate that service differently – an SLA view of a service different from an operational view – or business perspective
- Prioritizing data depending on metrics and elements
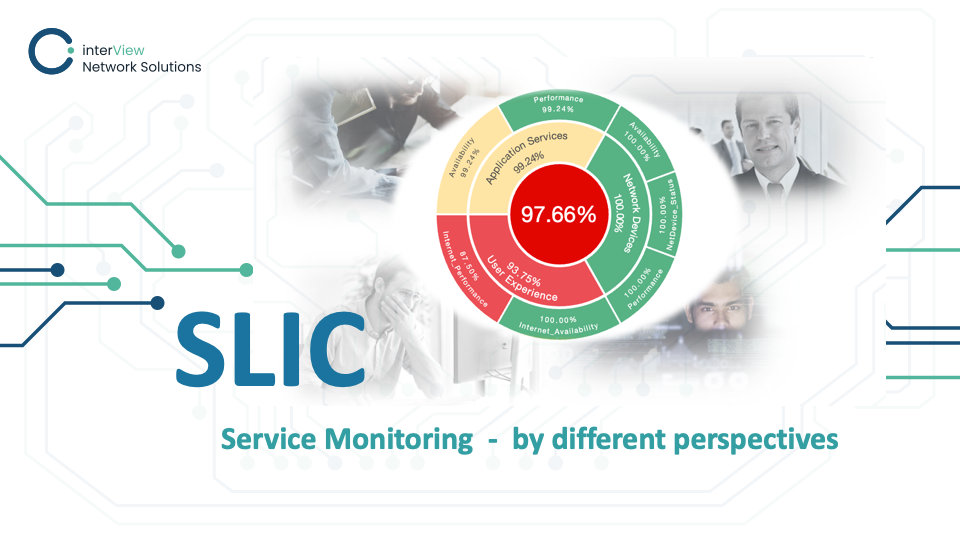
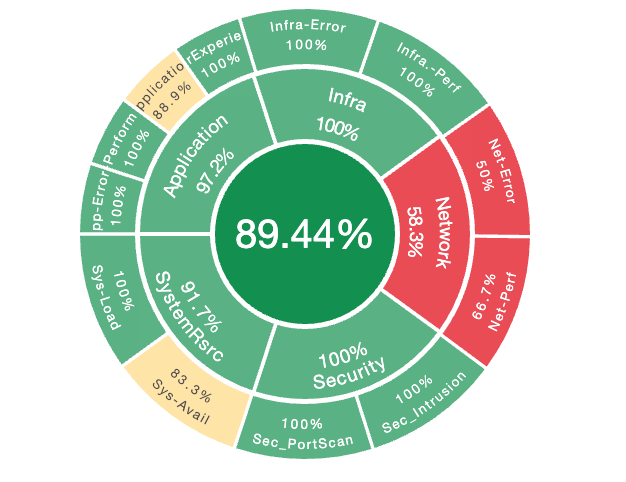
Service structures – are assessed individually as a whole and in their sub-structures. - In this way, a service value can be created for the entire IT operation, individual services – and their elements.
the determined KPIs – depending on service assignment
- in different views – depending on the business perspective,
- Critical success factors (CSF) aggregated for KPIs
- Presentation of the critical technologies and their elements
- impact of the elements and technologies both on each other
- (how does the network influence the application performance) and on the end view (e.g. business, SLA, user experience)
Output

Functions
- Slic connects all service-relevant technologies and key figures under one system
- Import and connect technology data, monitoring data from other systems, APM, NPM, security, business, production data
- Detect deviations from the “target” or “normal”.
Recognize the impact of deviations from all areas on each other and on the final service status - Views and reports for all levels –
- technical departments, Business departments, industrial manufacturing, ecommerce,
End-service customers, C management

benefits
- High transparency of business and IT status
- Clear allocation of the dependency between technologies and business
- Significant reduction of downtimes through faster identification of cause and effect
- Significant reduction of incidents – through precise optimization decisions

Interested?
schedule a demo
