Sharkmon – deep packet monitoring
- dive deep into the contents of thousands of PCAP trace files in a single dashboard.
- using Shark syntax for enabling more than 100.000 protocolfields
- Masses of data easy to organize, aggregate, analyze and prioritize.
- Grouped into 3 main categories – application – connection or network
- allows quick assignment of errors and incidents
- data saved in Database – long history
why sharkMon
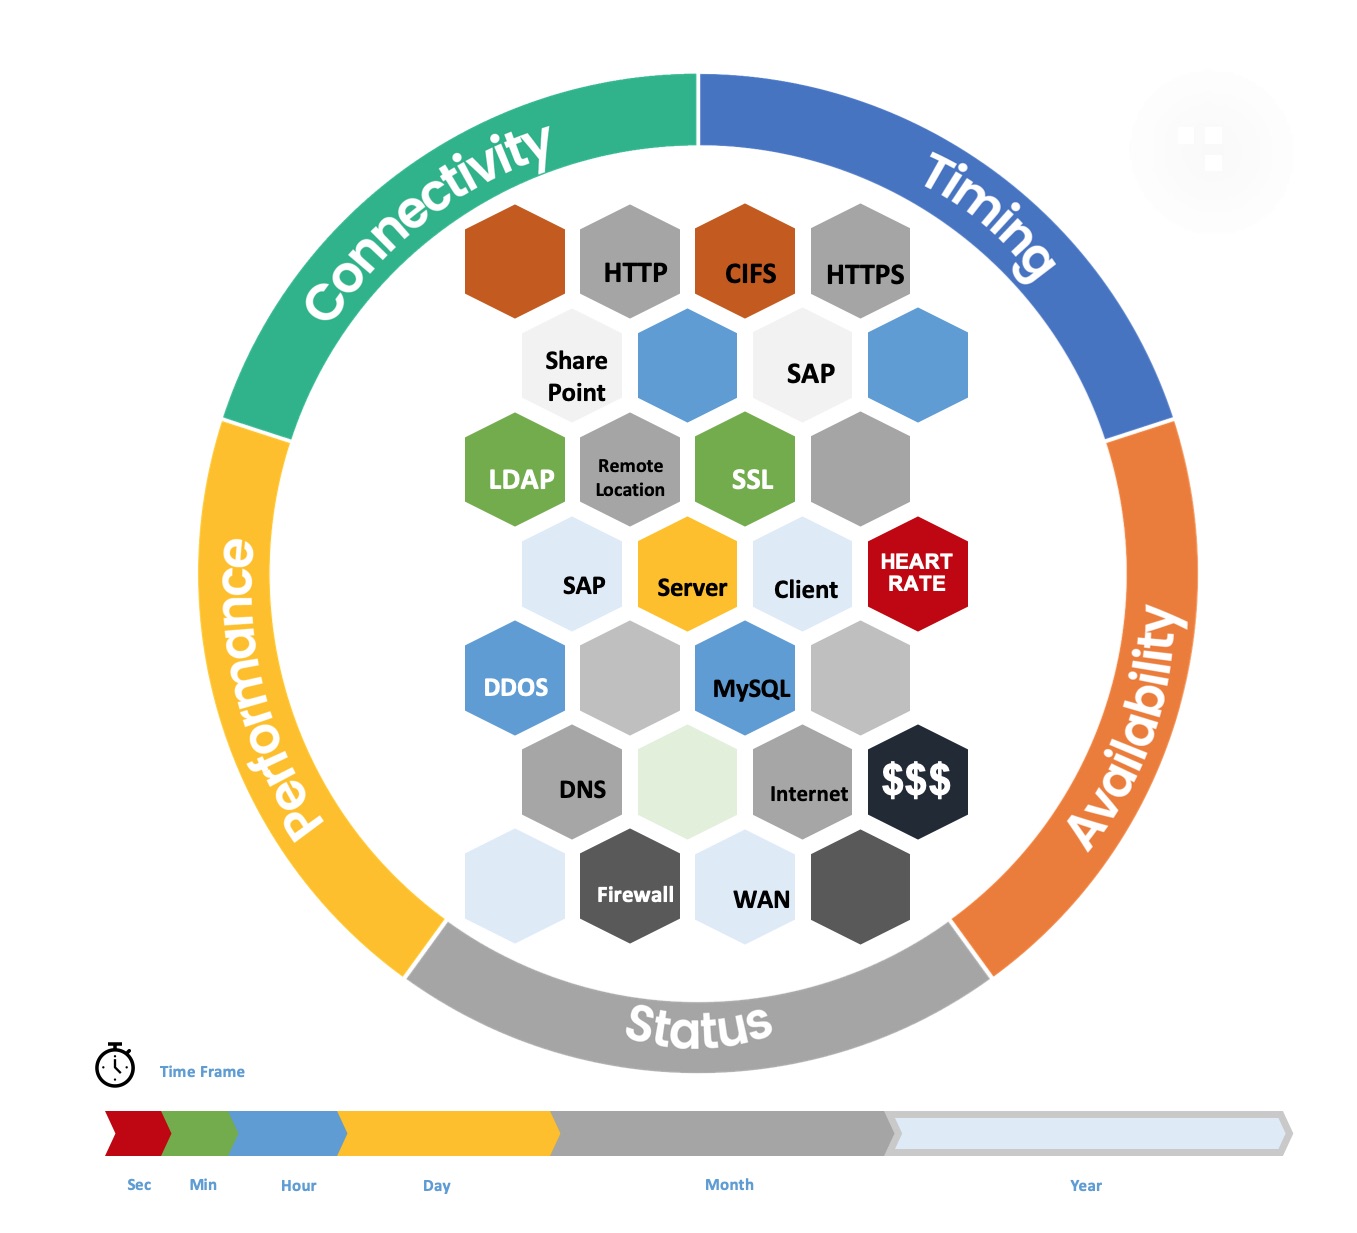
IT Data is network data – network packets travel the whole IT delivery chain – and transport the information about status and performance between endpoints: DNS und LDAP codes and times, Network and Application Performance, Server Responsetimes & Return Codes, Frontend / Backend Performance – or any content of a readable packet.
If Application is slow, Service not reachable, Error codes — infos about these symptoms – and often about the causes – can be found in packets.
sharkMon
– imports network packet data – and does provide required performance and status metrics conained in such packets.
– is using pcap files generated everywhere in the network – in the cloud on servers, at user PCs, firewalls, capture appliances etc. and can aggregate distributed capture sources into a single monitoring pane.
It can create incidents for root cause analysis and incident correlation and forward those incidents into central event correlation systems.
sharkMon – at a glance
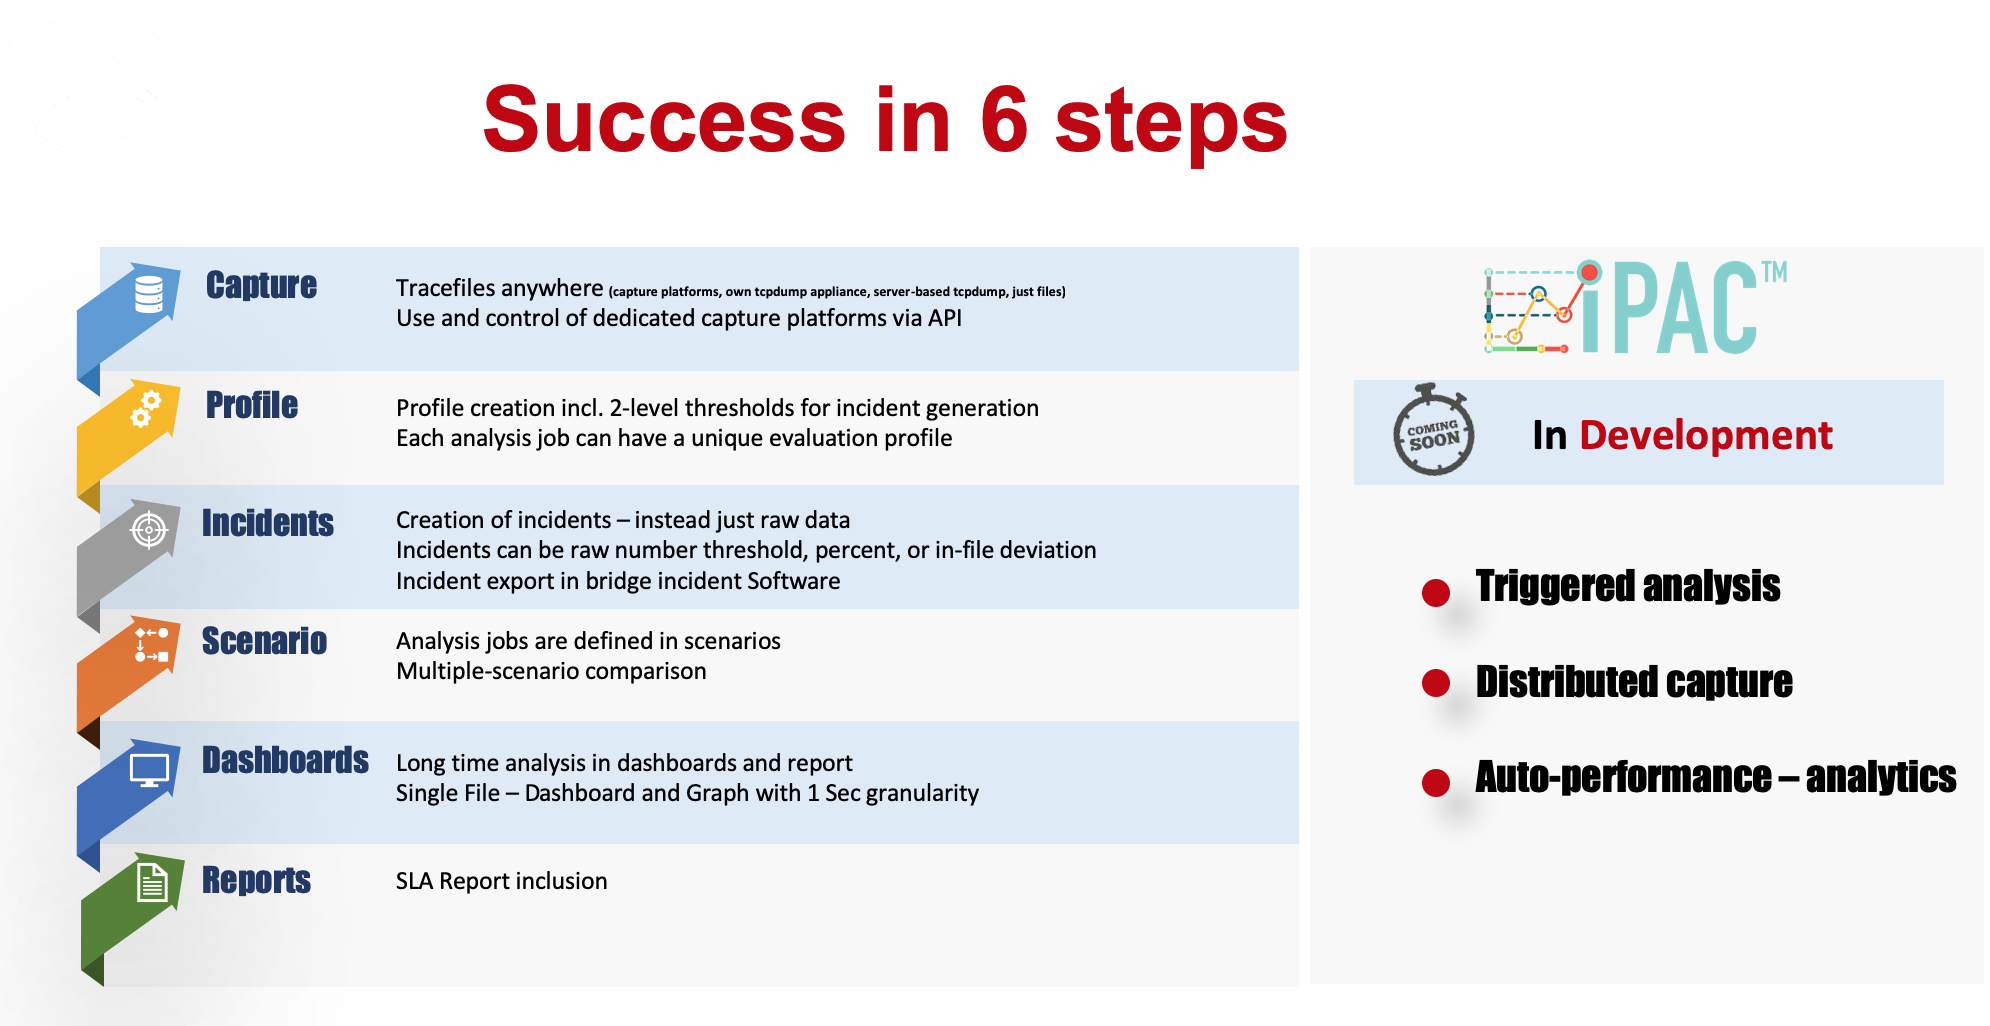
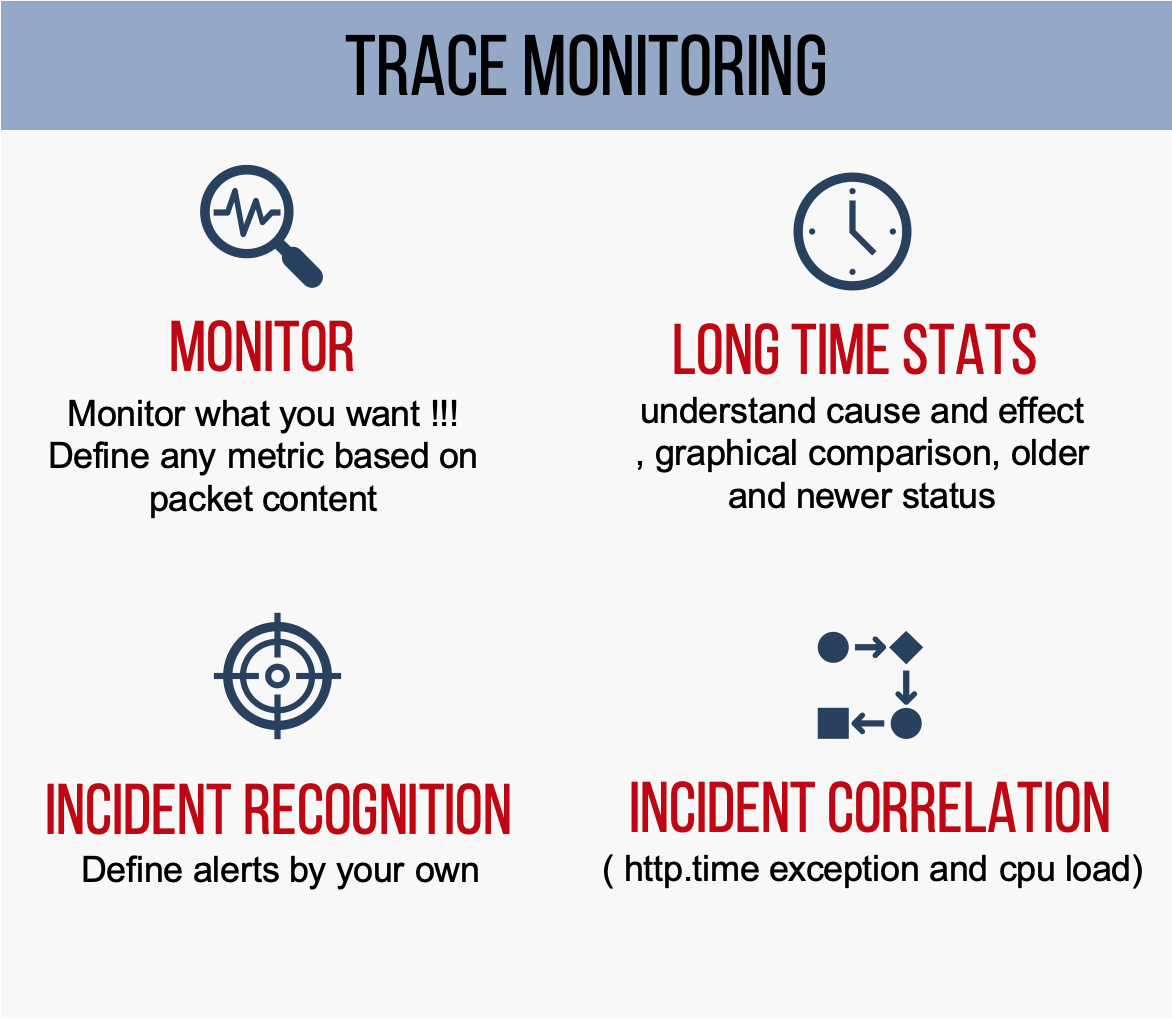
– longtime data – import realtime large numbers of pcap files for hours, days, weeks – created by various trace tools like Tcpdump, Tshark, or a capture appliance
– Auto-Analysis – analyze thousands of sequential files automatically on the fly by using customizable deep packet expert profiles – also per object – including custom metrics and thresholds
– Incidents – create incidents based on variable thresholds per object
– longtime perspective – visualize incidents and raw data in smart dashboards over hours, days , weeks or months
– Incident correlation – Export incidents into service management management, becoming part of correlation framework
– Automation – Automate the analysis workflows step by step – avoiding time and efforts for recurring tasks
Longtime monitoring – or single tracefile analysis ?
Tracefiles are usually manually analysed in single steps – just one at a time, covering a few minutes. For hours multiple files must be generated – for a day 100 or 1000 of files. This can not be done manually. with sharkMon user can import a large number of files from servers, cloud or datacenter appliances – assign an analysis profiles including the relevant metrics – and sharkMon creates required statistics and over the whole span of time – just monitoring.
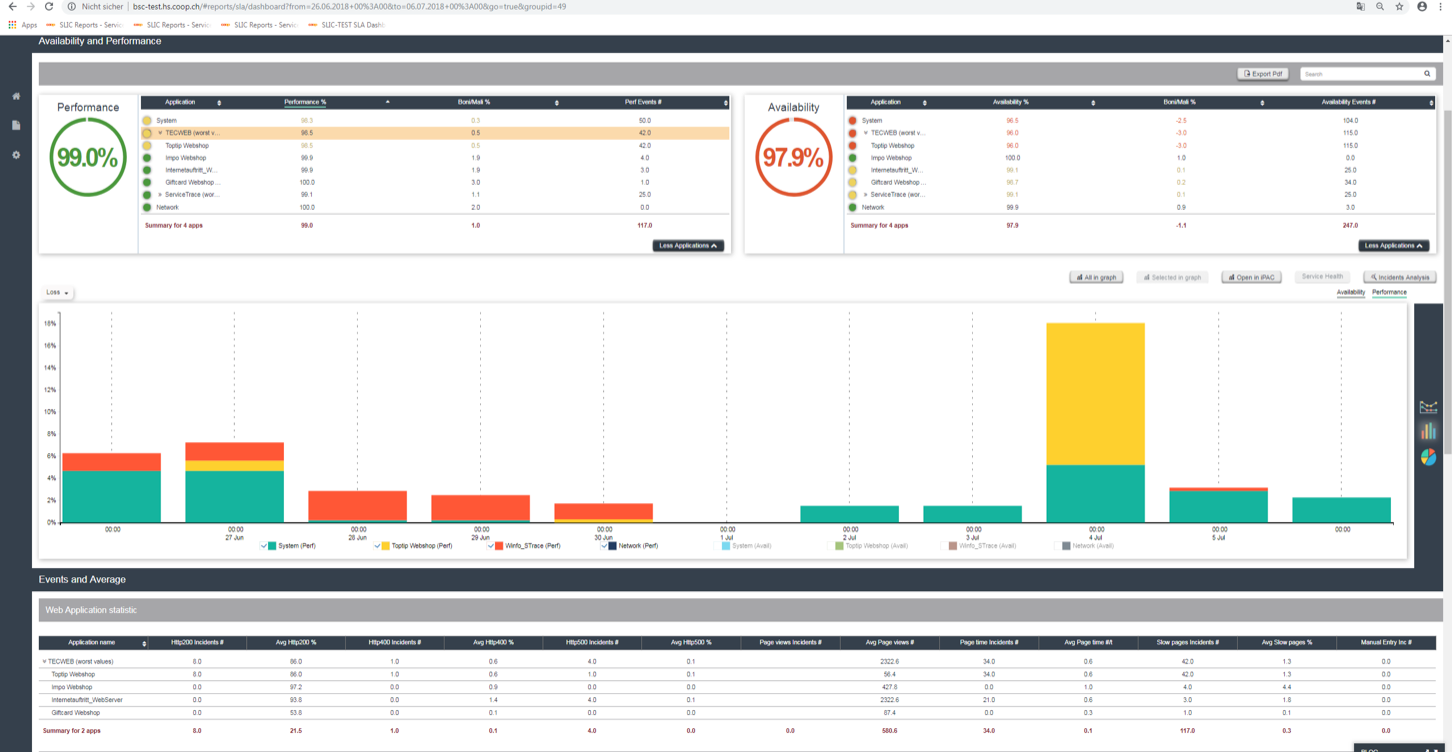
smart Dashboards
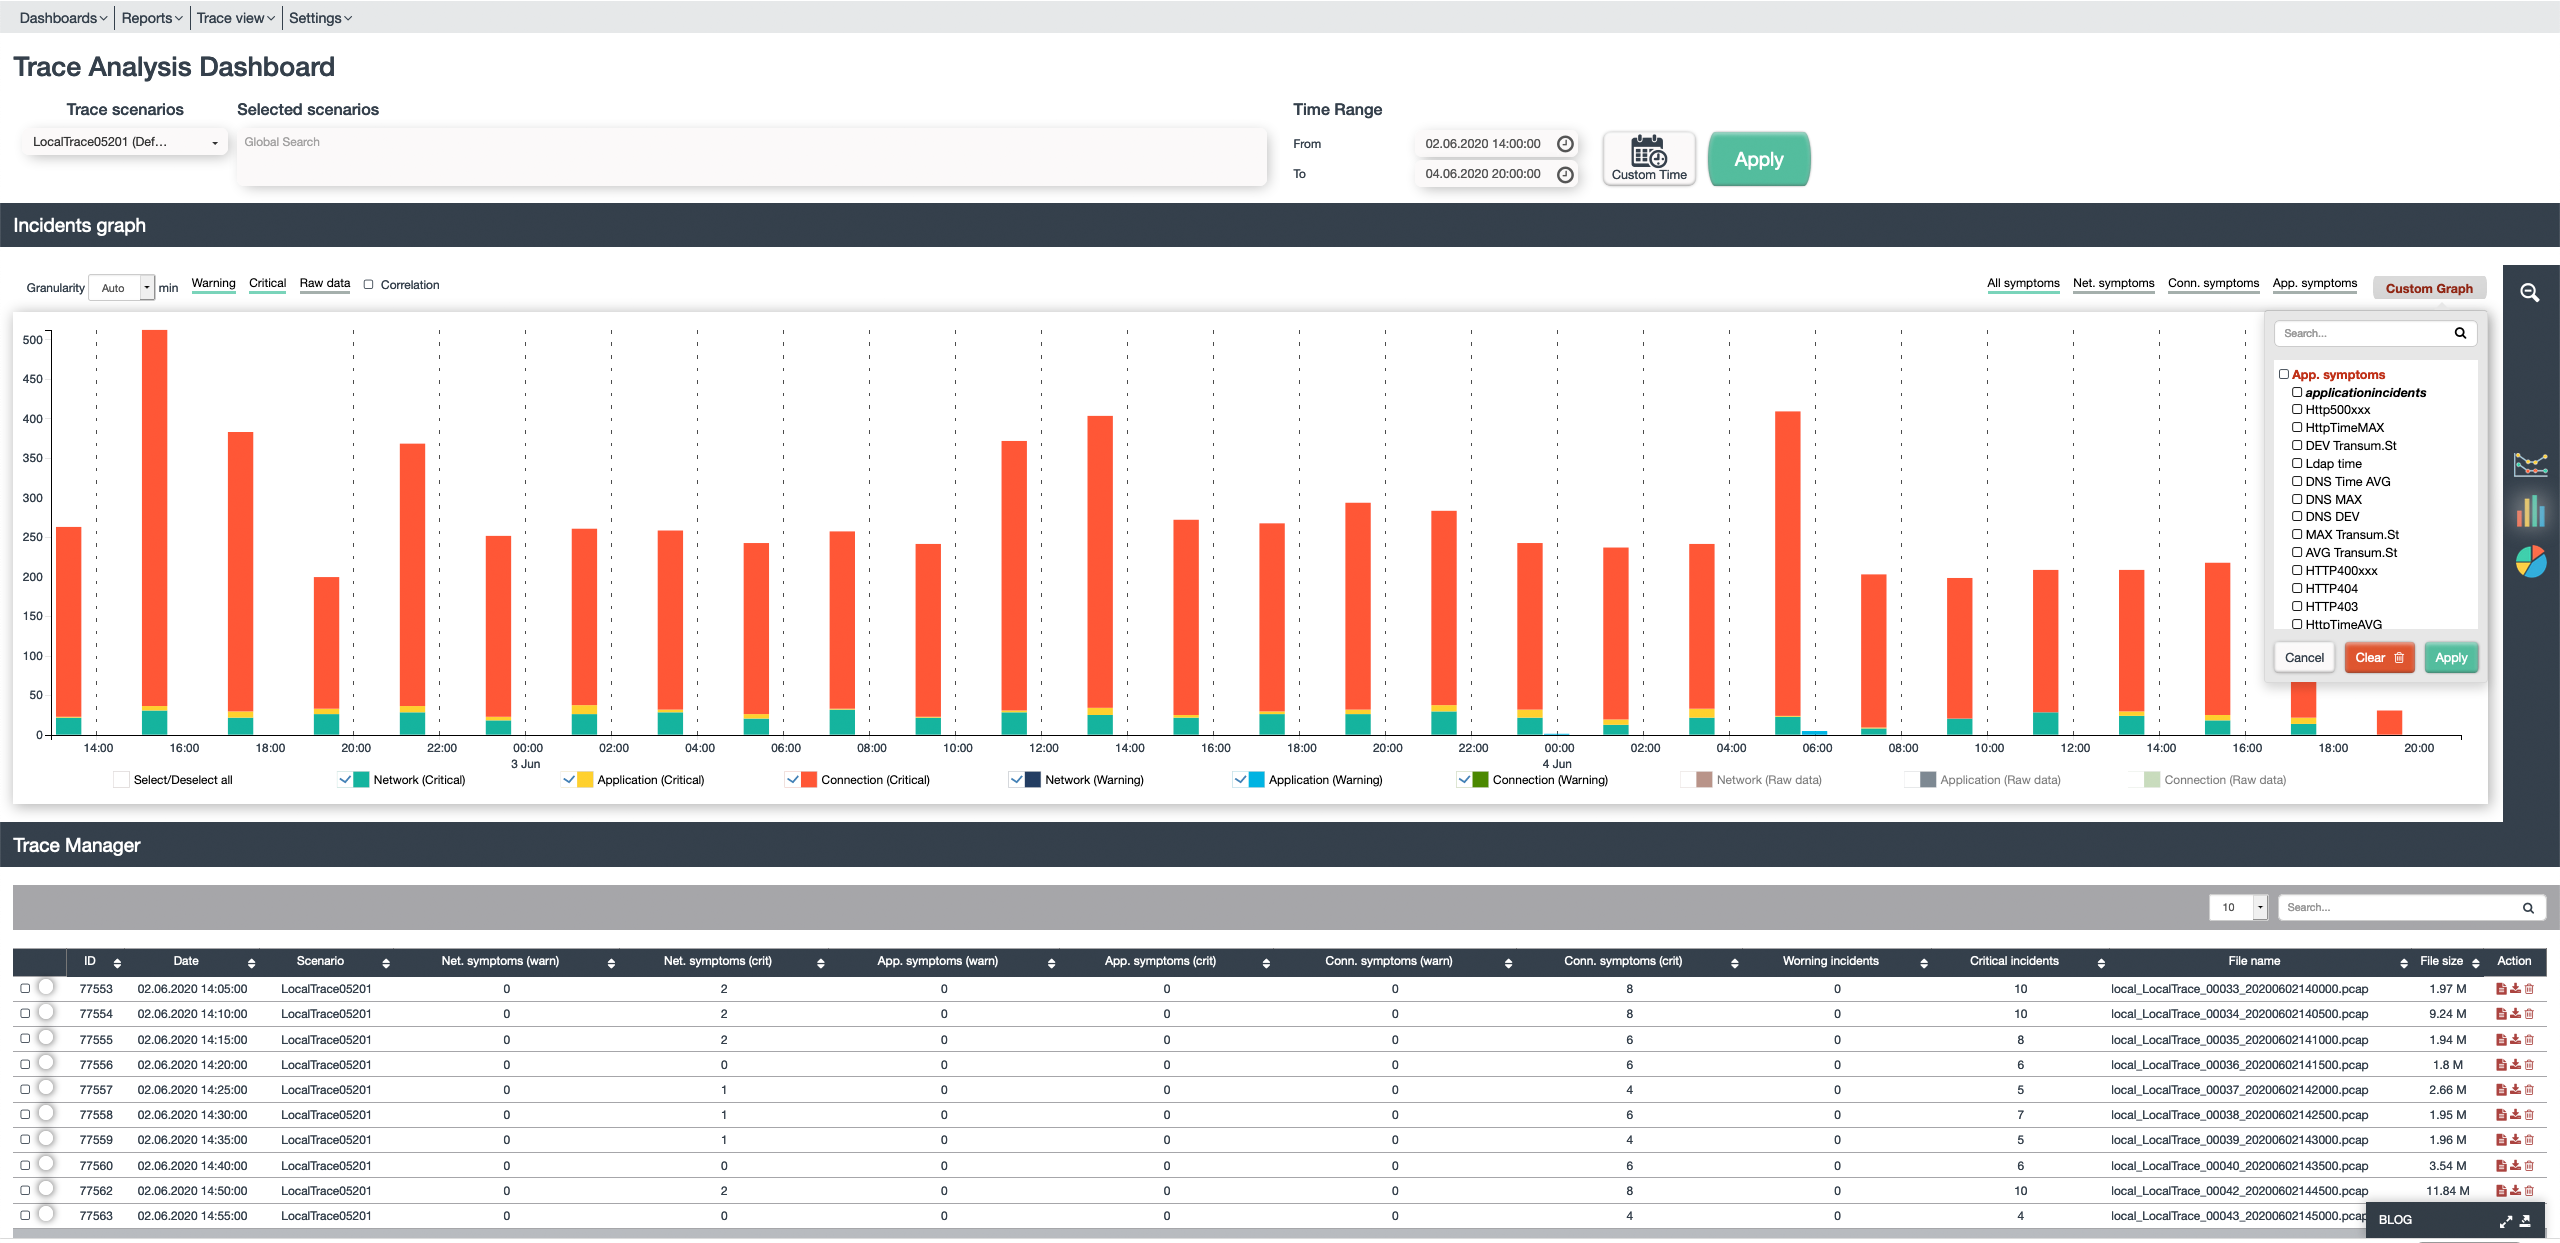
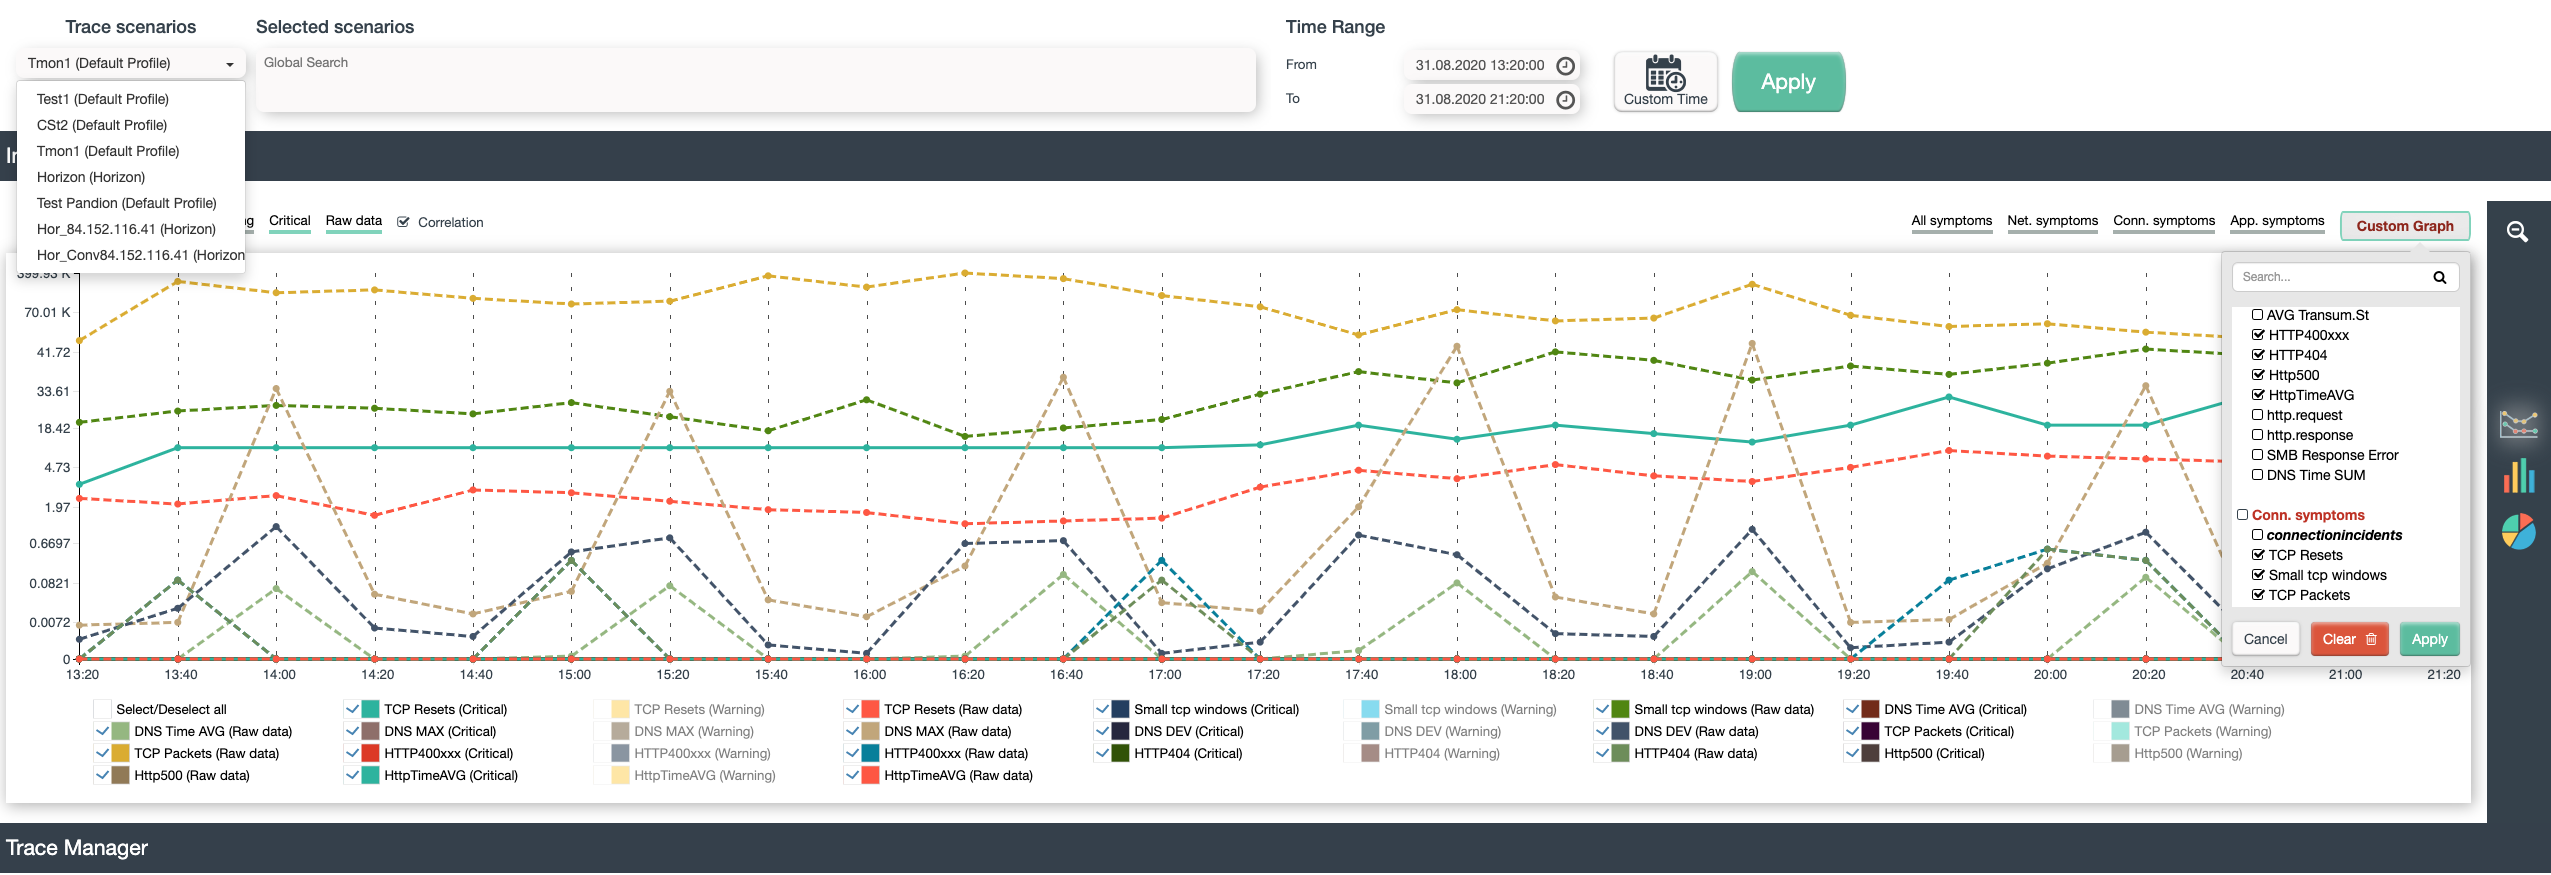
Just with a glance a user can understand:
- Are there any issues in my trace files
- To what category they belong too (network, application, connection)
- Which exact metric was causing that?
- What threshold was crossed
- Direct access to the trace file
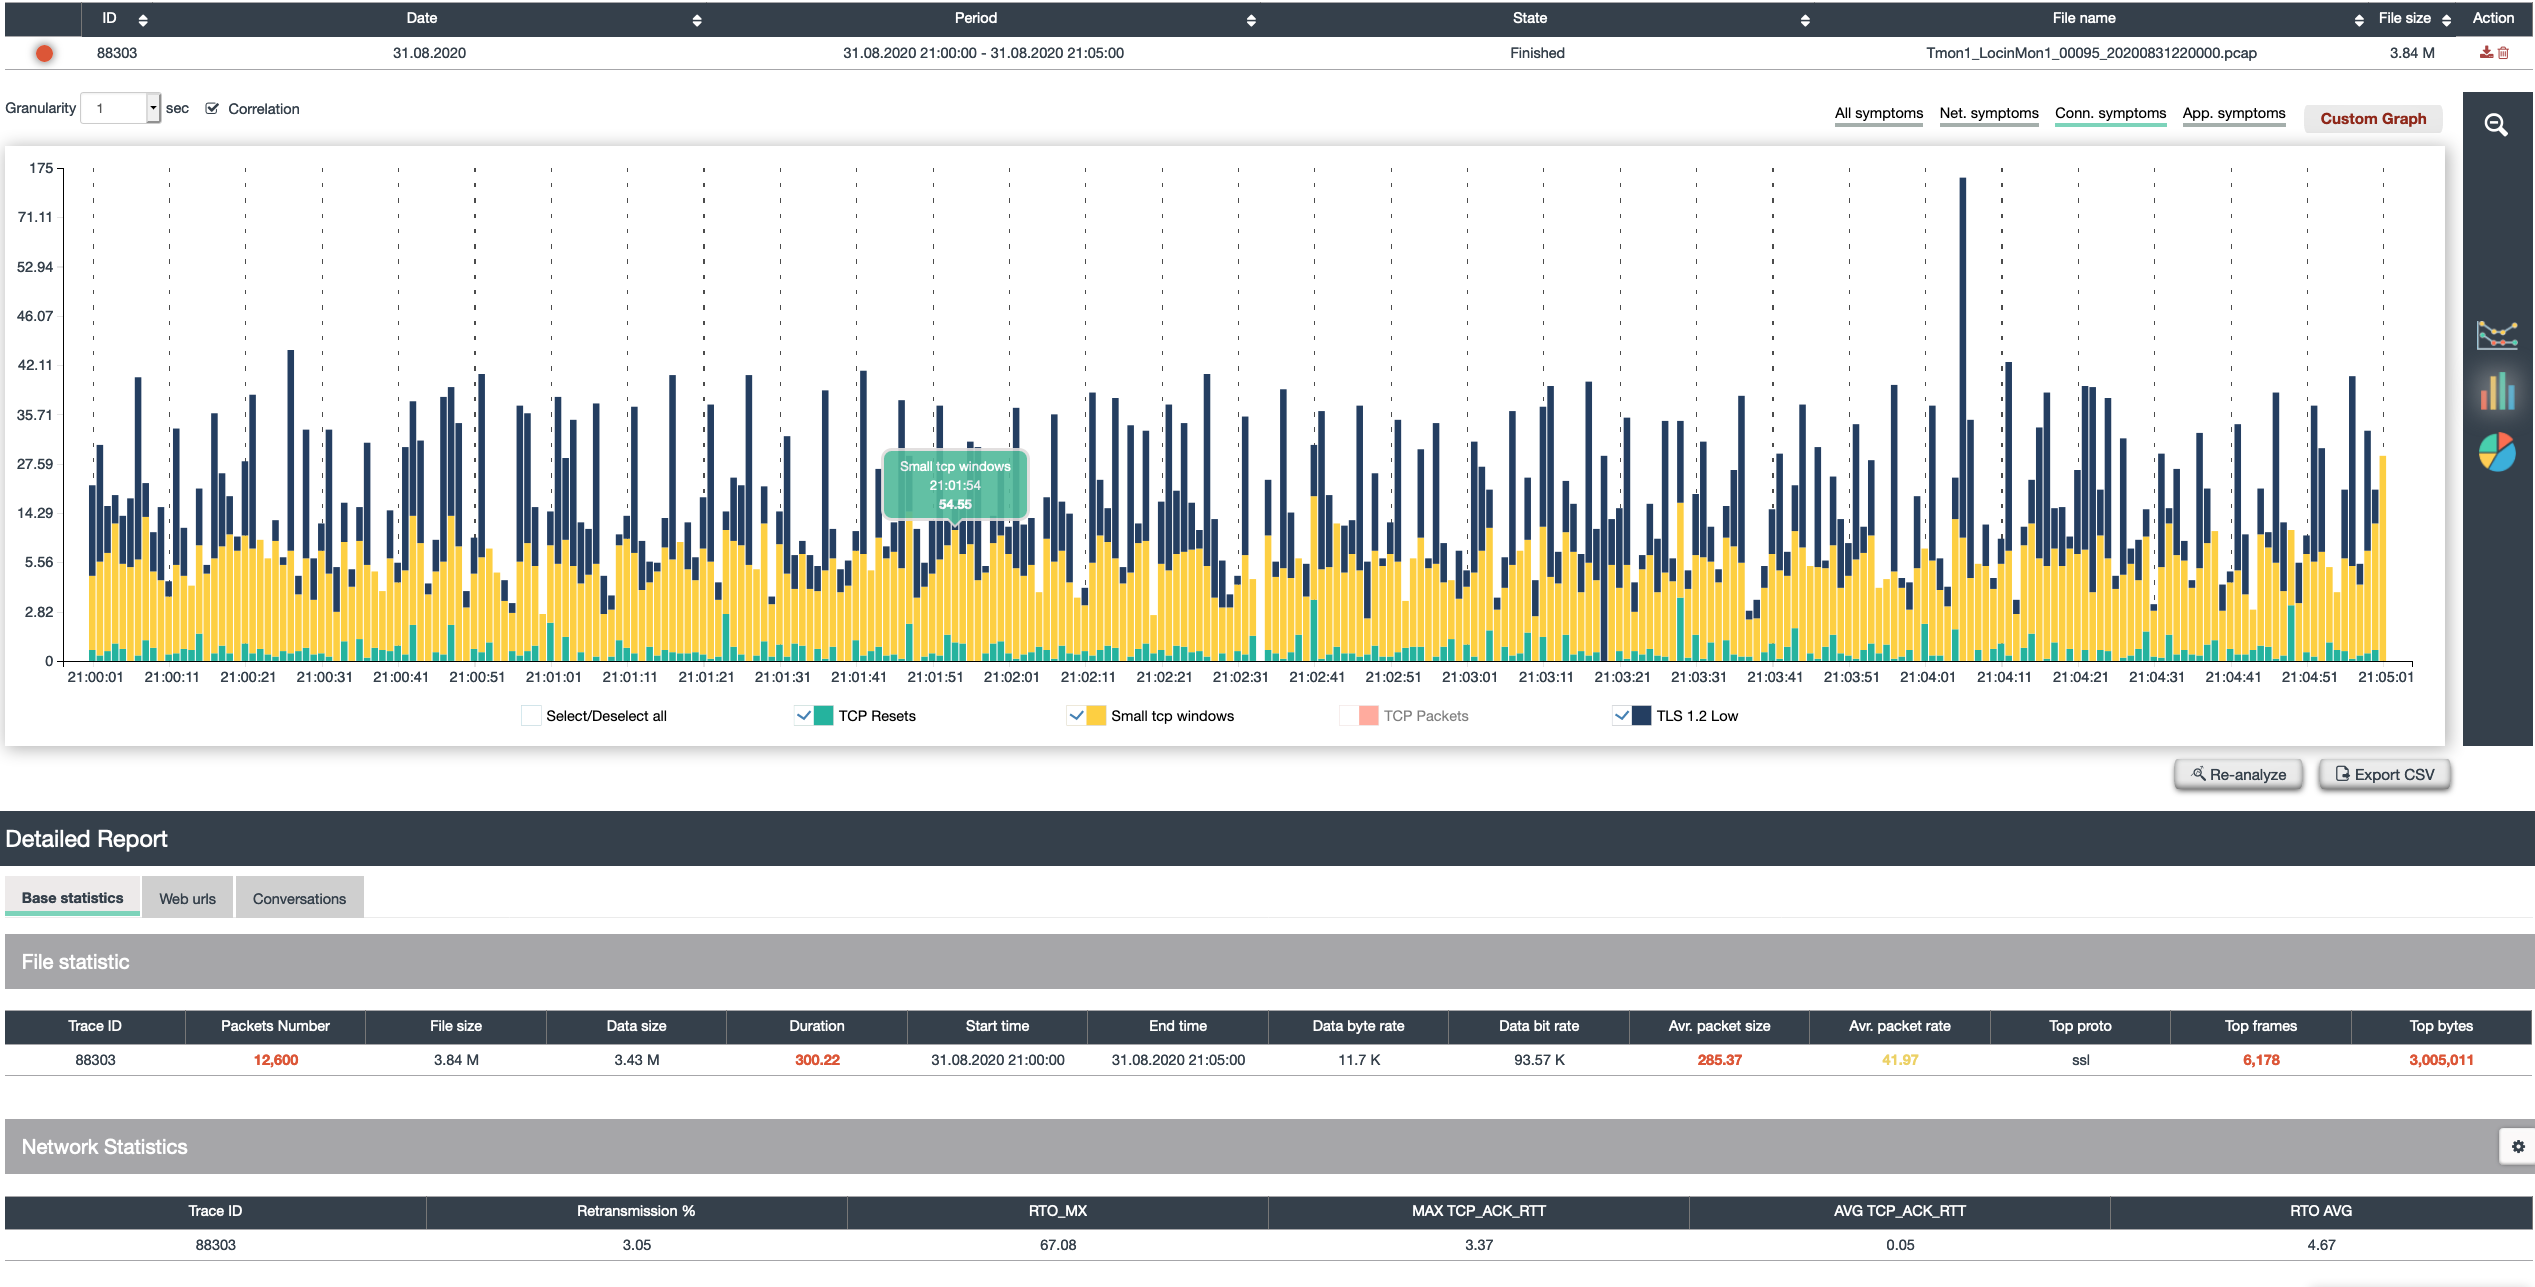
- Drilldowns and category specific
- views (here application view) allow deep insights- continuously over time – for days, hours or seconds
Deep Analysis
With Deep analysis InterTrace is utilizing Wireshark display filters – which can do a lot more than most other analysis solutions. Thousands of protocol-dependent prefilters are defined, analysis expert exist for a wide range of protocols. By using each possible Wireshark-Display filter in sharkMon – user can pretty much use every byte in the packet flow – as monitoring and incident condition.

sharkMon under the Hood
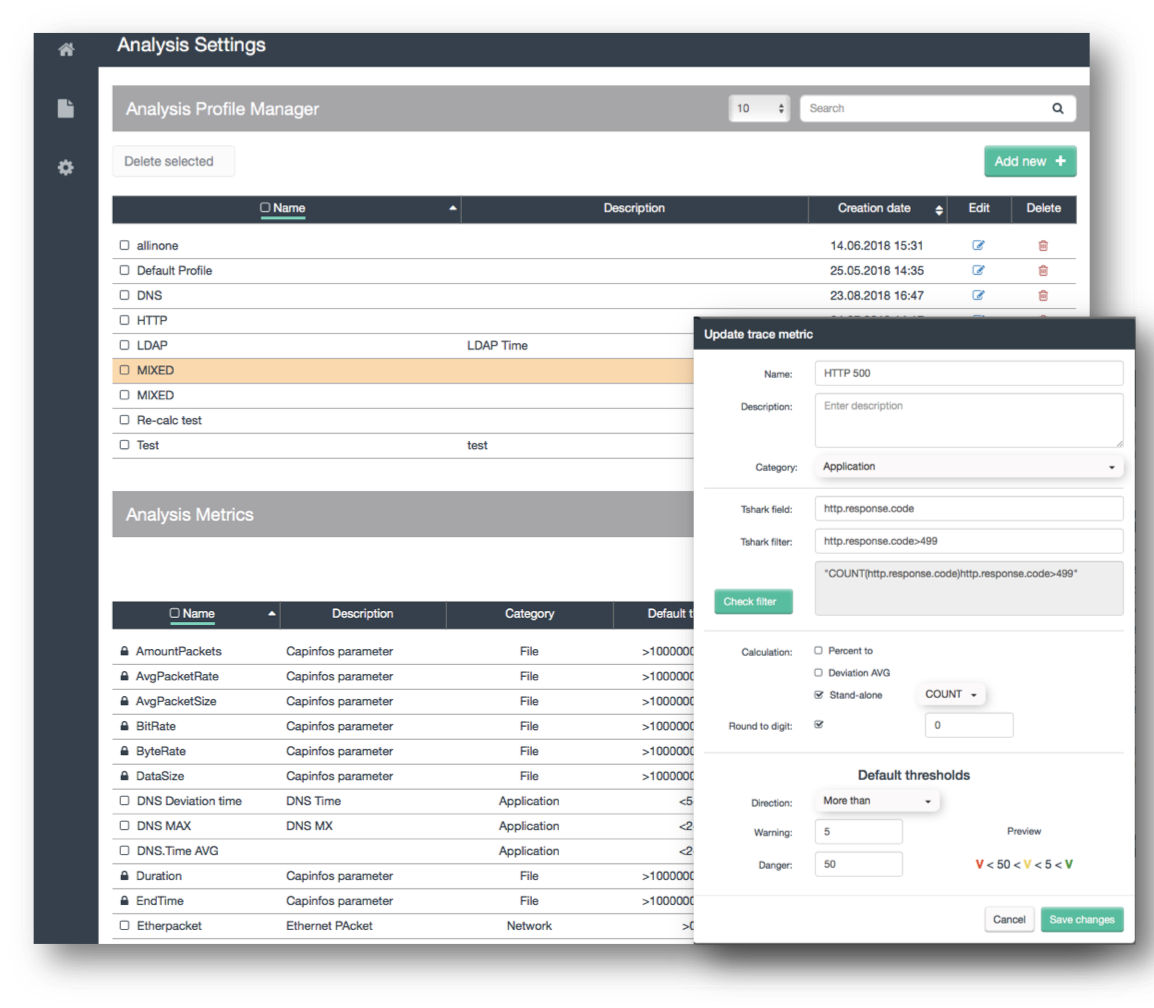
Analysis Profiles
Analysis profiles are pre-configured customizable filter-and-threshold definitions which will be applied to a trace-analysis. A profile is a configuration of defined filters and symptoms – pretty much each byte in a packet or a Wireshark-expert-analysis (like tcp_out_of_order) can be configured as symptom. Files will be analyzed very deep according to these profiles – and symptom are generated based on the analysis. Eg. if SSL uses TLS1.2 can be defined as condition, an occurrence on non-TLS1.2 packets can be seen and defined as symptom. Same can be done with performance metrics like LDAP.time, DNS.Time, DNS. responseCodes, HTTP return codes etc. – which can be included in a specific profile and symptoms created if a threshold is exceeded.
Die Front-End- sowie Backend Server-Systeme werden aufgelistet bzw. in einem Architektur-Chart dargestellt.
Da die Service Discovery täglich durchgeführt wird, sind die Architektur Charts immer aktuell.
Änderungen innerhalb einer Service Kette, z.B. neue Server, werden erfasst und ausgewiesen.
Scenarios
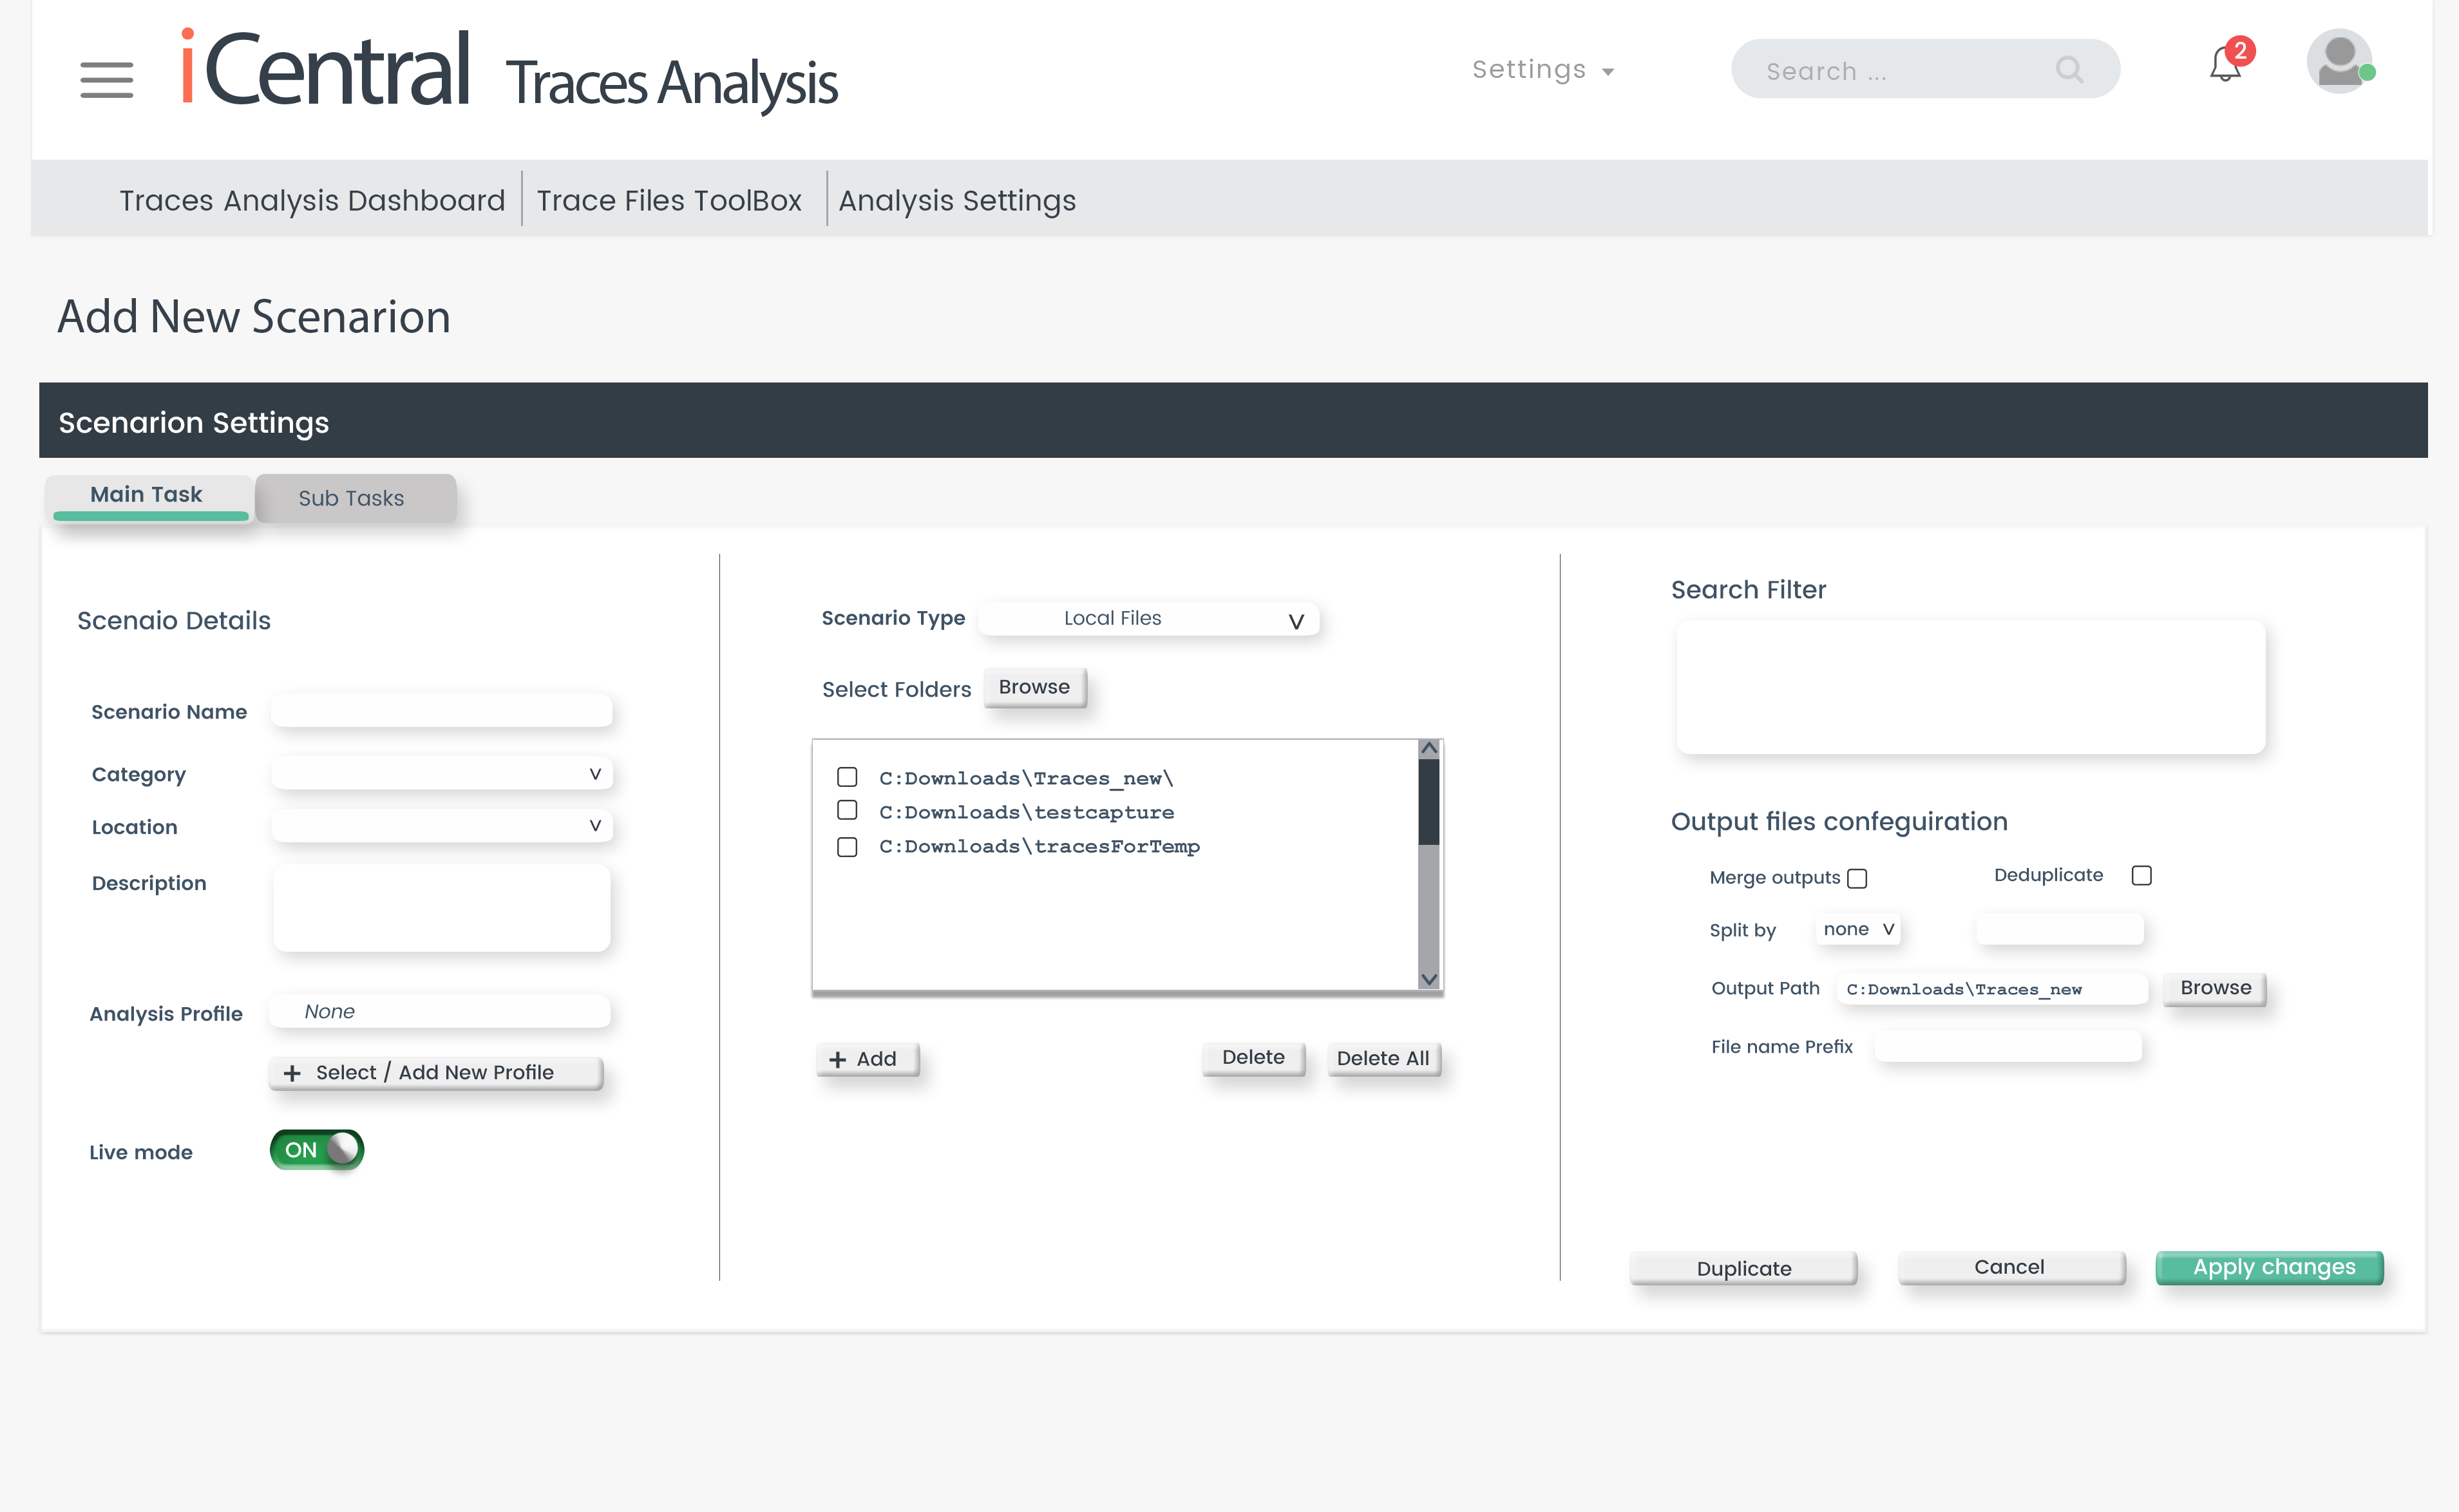
User define their analysis objects and metrics as an analysis scenario:
- Object – What I need to analyze
- Conditions – filter conditions, time (backward or future)
- Data source – PCAP files, active Wireshark/tcpdump srtewam , capture appliance
- Options – for analysis purpose (like de-duplication, merging).
- Intelligence – What analysis profile should be used, which includes metrics thresholds etc.
Such a scenario gives the user the ability to start a longtime-monitoring process on a deepest level – focus on this scenario and create scenario-related incidents and events. Many scenarios can be defined and processed parallel – so one scenario can work on the web shop using deep SSL and HTTP metrics, another can monitor SAP services and another the DNS replies – same time.
Trace-based events can be correlated with other existing management data, if coming from Network, Systems, Logfiles or security devices in a single dashboard- like SLIC Correlation insight. They can create the significant data – which can feed a service management platform with the intelligence to create complete cause & effect chains for complex IT-services.
