Multiside Trace correlations to understand precise the performance causes.
Problem
When understanding performance issues in Application experience, it is often required to understand and measure the response time on the client side – like the service responsetime. In Wireshark people can use transom for such measurement.
But the problem is always – the “server responsetime” at the client includes the network time with all its variables, like latency etc. so – client-side-Experience = network time + service time.
How to get the precise information – what is the network time – and what the server time ?
how to
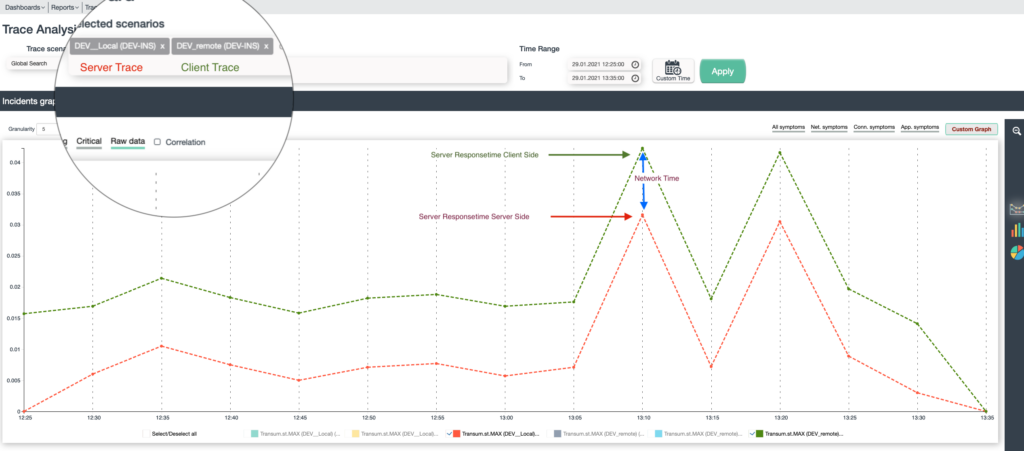
Using Intertrace people can correlate both side in a single view – by collecting serverside – and client-side traces and correlate them in a single view
The picture below shows clear
- The service responsetime on the client
- The service response time at the sever
- The gap between – the network time
This approach can be used for all applications using TLS or any other protocol.


